


The Nifty fell for seven sessions on the trot, to close at 17,393 on Monday. The index failed to register follow-up selling after violating crucial support of 17,353, which happened to be the Budget day’s low. From the day's low of 17,299, the benchmark index recovered more than 100 points and closed with a bullish 'hammer' candlestick pattern on the daily chart.
Bank Nifty gained more than 1 percent and outperformed the Nifty with good margin. After forming “Doji Star” candlestick pattern on the February 23, 2023, Bank Nifty closed with bullish “Engulfing” candle pattern on the daily charts.
The Nifty has managed to close above its 200-day SMA, placed at 17,376. This setup indicates possible short term bullish trend reversal.
FIIs' Long to Short ratio in the Index future has remained near to oversold levels for the entire February month. On February 24, 2023, there was a massive open interest build up in the Bank Nifty. Derivative data suggest that there could be sharp short covering in the benchmark indices if they manage to hold above their respective 200-day SMAs.
However, looking at the primary trend on the weekly charts, it would be advisable to lighten long positions at higher levels. Nifty has got stiff resistance in the zone of 17,700-17,750 zone. Resistance for BankNifty is expected in the range of 41,100-41,200.
Here are three buy calls for next 2-3 weeks:
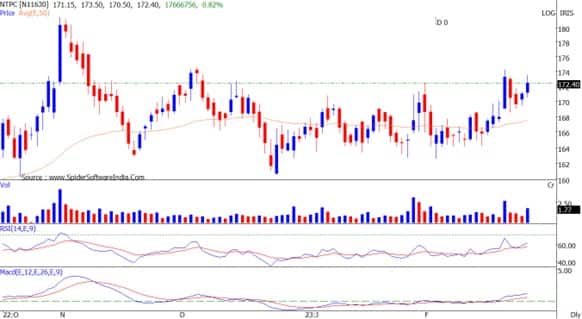
NTPC: Buy | LTP: Rs 172 | Stop-Loss: Rs 167 | Target: Rs 180 | Return: 4.4 percent
The stock price has been forming higher tops and higher bottoms on the daily chart. Stock has broken out from bullish Cup and Handle pattern on the daily chart.
Price breakout is accompanied by jump in volumes. PSE sector has been outperforming for last couple of months. The stock is placed above long term moving averages, which indicates bullish trend positionally.
Coromandel International: Buy | LTP: Rs 892 | Stop-Loss: Rs 837 | Targets: Rs 988-1,030 | Return: 15 percent
The stock price has surpassed its 50-day EMA (exponential moving average) resistance. Stock price has formed higher top and higher bottom on daily line chart.
It is on the verge of breaking out from downward sloping trend line on the daily charts. Volumes have gone up along with the price rise recently. Indicators and oscillators have turned bullish daily time frame.

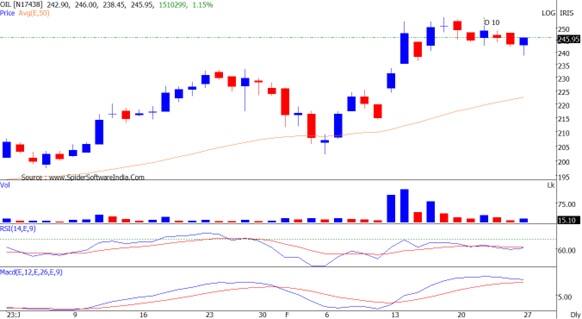
Oil India: Buy | LTP: Rs 245 | Stop-Loss: Rs 232 | Target: Rs 265 | Return: 8 percent
Primary trend of the stock is bullish as it has been trading above its 50, 100 and 200-day EMA. For last couple of weeks, stock is consolidating in the narrow range with lower volumes.
Stock is in formation of “Flag” pattern on the daily chart. Oil & Gas sector has been outperforming for last couple of weeks. Indicators and oscillators have been showing strength on the daily and weekly charts.

Discover the latest Business News, Sensex, and Nifty updates. Obtain Personal Finance insights, tax queries, and expert opinions on Moneycontrol or download the Moneycontrol App to stay updated!
Find the best of Al News in one place, specially curated for you every weekend.
Stay on top of the latest tech trends and biggest startup news.


